I encountered this task at work where I needed to monitor a local machines that are considered critical for us in terms of tests runners and CI. The machines were running a few services that required some effective monitoring and alerting.
Recently, our team has transitioned from NewRelic to Coralogix for monitoring, and integrating it with OpenTelemetry Collector Contrib was done for all of our local machines. This post details the steps involved.
After a short research, I found out that OpenTelemetry Collector Contrib has a [hostmetrics receiver] that can be also used to monitor local machines and send the data directly to our new vendor - Coralogix.
OpenTelemetry provides a single set of APIs and libraries that standardize how you collect and transfer telemetry data. You can use these APIs and libraries to instrument your code and send telemetry data to a backend of your choice. The OpenTelemetry Collector offers a vendor-agnostic implementation on how to receive, process, and export telemetry data. In addition, it removes the need to run, operate, and maintain multiple agents/collectors in order to support open-source observability data formats (e.g. Prometheus, etc.) sending to multiple open-source or commercial back-ends.
So let's start
Download the otelcol-contrib binary for your platform from OpenTelemetry GitHub.
If you're using Coralogix as well, you'll need to obtain your Coralogix Private Key and set it along with other required environment variables:
CORALOGIX_DOMAIN
CORALOGIX_APP_NAME
CORALOGIX_SUBSYS_NAME
CORALOGIX_PRIVATE_KEY
Create a config.yaml file, including necessary metrics, scrapers, log level, and intervals. Refer to OpenTelemetry's Host Metrics Receiver for further information.
Add coralogix as an exporter in the config, as shown below as an example:
receivers:
  hostmetrics:
    collection_interval: 30s
    scrapers:
      network:
      cpu:
      memory:
      disk:
exporters:
  coralogix:
    traces:
      endpoint: 'otel-traces.${CORALOGIX_DOMAIN}:443'
    metrics:
      endpoint: 'otel-metrics.${CORALOGIX_DOMAIN}:443'
    logs:
      endpoint: 'otel-logs.${CORALOGIX_DOMAIN}:443'
    domain: '$CORALOGIX_DOMAIN'
    private_key: '$CORALOGIX_PRIVATE_KEY'
    application_name: '$CORALOGIX_APP_NAME'
    subsystem_name: '$CORALOGIX_SUBSYS_NAME'
    application_name_attributes:
      - 'service.namespace'
    subsystem_name_attributes:
      - 'log.file.name'
      - 'service.name'
    timeout: 30s
  logging:
    verbosity: normal
service:
  pipelines:
    metrics:
      receivers:
        - hostmetrics
      exporters:
        - coralogix
Execute the binary with the config file flag:
./otelcol-contrib --config=config.yaml
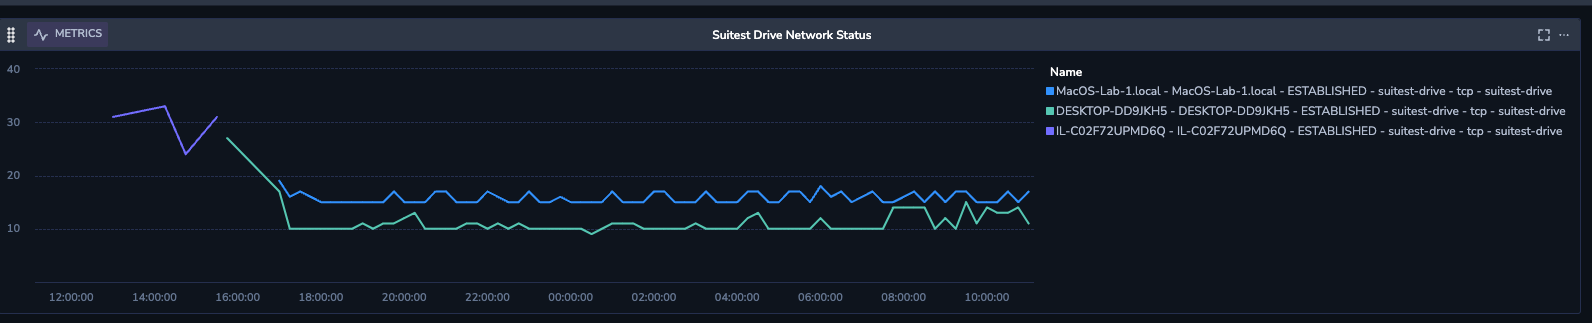
And there you go. You should be able to see the metrics in your metrics vendor exploration by the subsystem name or application name.